In an earlier post, I presented the new UDF & UDA features introduced by Cassandra 2.2. In this blog post, we’ll play with UDA and see how it can be leveraged for analytics use-cases and all the caveats to avoid.
Recently, there was a discussion on the Cassandra mailing list about an user having time out with UDA. After some exchanges with the devs, I decided to start the following test scenarios to confirm an intuition of mine.
For the remaining of this post Cassandra == Apache Cassandra™
Scope of the tests
We need to define clearly the scope of our tests. The idea is not to tests every possible use-cases but only some common use-cases to confirm or infirm some initial assumptions.
The hardware setup:
- Cassandra 3.1.1: 1 MacBookPro 15″ 16Gb RAM SSD
- Test client: 1 MacBookPro 13″ 16Gb RAM SSD, Java Driver 3.0.0-rc1
- Boths machines connected through a 1Gb network router
The data set:
- Test table
CREATE TABLE IF NOT EXISTS test_uda.sensor(
    sensor_id int,
    time bigint,
    value double,
    PRIMARY KEY(sensor_id, time)
);
The table structure is very simple, on purpose, so that we can equate 1 CQL row to 1 physical column on disk
- Insert 10 x 106 data points in a single partition (timeseries use-case)
The test protocol:
- Insert 10 x 106 data points into the table. sensor_id=10 (fixed value) and time varies from 1 to 10 x 106. The double value column is randomized between 0 and 100
- Nodetool flush to force a flush to disk of all data in memtable
- Start querying the data using the standard avg() aggregate on the partition, with different query parameters and time ranges. Consistency level is set to ONE
The current test only focus on single partition aggregation query scenario but we’ll also discuss multiple partitions queries.
The source code of the test project can be found on GitHub here
Tests results
A First raw results
First, I used the command line cqlsh tool on the Cassandra server itself (so local access, no network) to perform some initial checks, below are the raw results:
cqlsh:test_uda> select avg(value) from sensor WHERE sensor_id=10;
OperationTimedOut: errors={}, last_host=192.168.1.17

cqlsh:test_uda> select avg(value) from sensor WHERE sensor_id=10 AND time>=1 AND time<=1000000;

 system.avg(value)
-------------------
          49.95645

(1 rows)

cqlsh:test_uda> select avg(value) from sensor WHERE sensor_id=10 AND time>=1 AND time<=2000000;

 system.avg(value)
-------------------
          49.99266

(1 rows)

cqlsh:test_uda> select avg(value) from sensor WHERE sensor_id=10 AND time>=1 AND time<=3000000;
OperationTimedOut: errors={}, last_host=192.168.1.17
If we want to aggregate on the whole wide partition, the query times out. By reducing the time range to the interval [1, 106], it works. But then the query fails when we go beyond 3 x 10⁶ columns.
Why did the query fail ? That’s an interesting question…
B Internal query handling
My first guess was that the server had to load the entire 3 x 10⁶ columns into the JVM heap and it took time, so the query timed out (read_request_timeout_in_ms = 5000 by default in cassandra.yaml)
But Tyler Hoobs has said on the mailing list that Cassandra is clever enough to execute the read by page and does not load the entire 3 x 10⁶ data set in memory at once. Furthermore, the read_request_timeout_in_ms parameter does apply on each page, but not on the whole aggregation request, so the query should have finished successfully but it didn’t.
My intuition is that it has failed because of client-side timeout settings. So I decided to extend the ReadTimeoutMillis property of the Java driver. The default value is 12 000 (12 secs) and I changed it to 200 000 (200 secs), a ridiculously huge value to exclude any possible client-side timeout issue.
With this special timeout, the SELECT avg(value) FROM sensor WHERE sensor_id=10 query returned a result after ≈ 13 secs (it would have timed out with the default setting).
The conclusion is: from the client-side, timeout settings should be tuned specifically for aggregation queries.
The default 12 secs timeout value, although perfectly reasonable for real time OLTP queries, is too restrictive for aggregation queries that require fetching a great amount of data server-side. 13 seconds to aggregate 10 x 106 columns is not surprising and quite expected indeed (read througput ≈ 800 000 columns/sec).
I’ve created the JIRA JAVA-1033 on the Java driver side to allow setting timeout per query and not globally.
C Parameters impacting aggregation performance
In addition to the timeout setting, the performance of an aggregation query also depends on:
- Consistency Level: using consistency level > ONE will requires the coordinator to ask for the data from different replicas, and this for each page. It means that the global query performance is bound to the slowest replica read performance
- Paging size: setting an appropriate paging size can help grabbing a few precious seconds on the overall query duration. See chapter D below for more detais
- Read Repair: when using consistency level > ONE, if the data are not synced between the replicas, Cassandra will trigger read-repair for each page of data. This read-repair cost will add up to the global query time and you need to take this factor into account
- Partition(s) count: generally single partition aggregations grant the best performance for obvious reason but it does make sense to perform an aggregation on multiple partitions or on the whole table. After all, UDA has been designed for this scenario in mind. In this case, you should not be surprised that your aggregation takes a while to complete and you should extend the client timeout accordingly. Please note that read-repair does not trigger for multi-partitions queries
- Amount of fetched data: this parameter is pretty obvious but is worth mentioning. Aggregations in Cassandra are not distributed, all data are fetched on the coordinator before applying any aggregation function. This is necessary because of the eventual consistency architecture and last write win reconciliation model. If you can compute your aggregation on chunks of data (in other words, if your aggregation algorithm is commutative and associative), you can perform aggregation on pages of data and apply the algorithm on intermediate results
D Which page size to choose ?
SELECT avg(value) FROM test_uda.sensor WHERE sensor_id=10
I’ve done some test scenarios with different page sizes. When tracing is enabled, Cassandra will give you the time spent for each aggregation:
| Page size | Query time (µs) |
|---|---|
| 100 | 41 589 557 µs |
| 500 | 17 890 618 µs |
| 1000 | 15 024 828 µs |
| 10000 | 13 476 753 µs |
| 50000 | 11 200 027 µs |
| 80000 | 11 008 073 µs |
A graph illustrates it better:
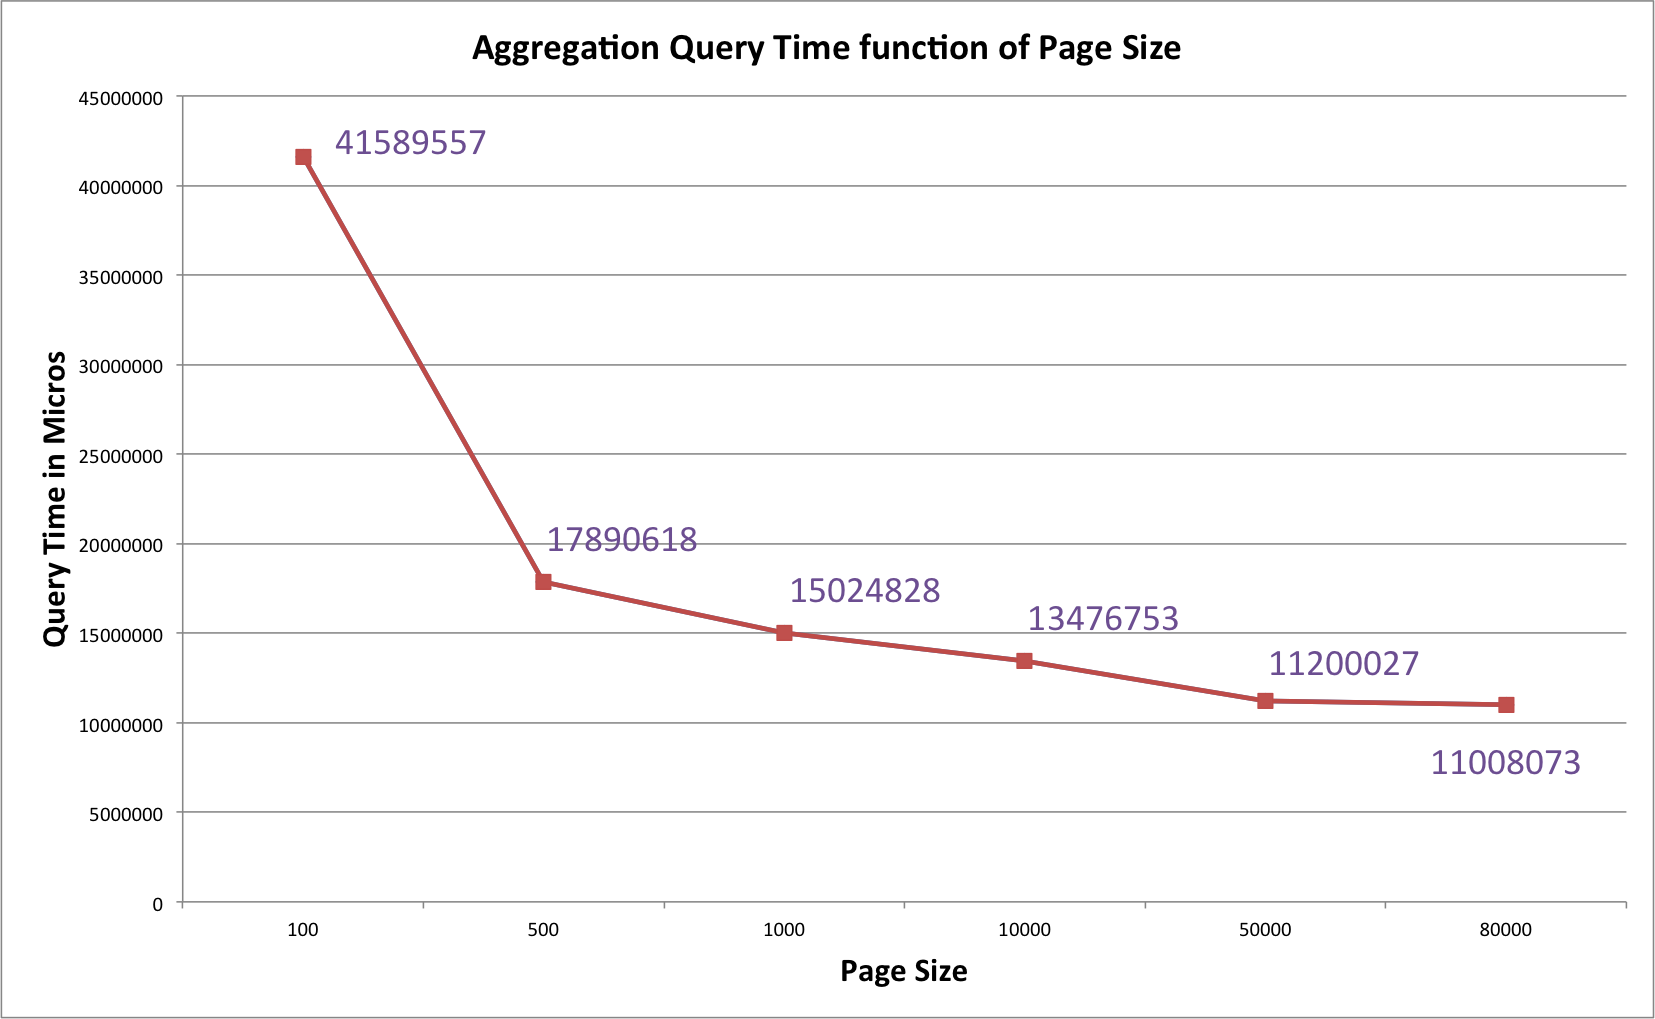
Query Time vs Page Size
The query time has a logarithmic decrease with regard to page size. The optimal page size in our example is 50 000.
I also graph the impact of number of retrieved columns on the query time using page size 50 000:
SELECT avg(value) FROM test_uda.sensor WHERE sensor_id=10 AND time>=? AND time<=?
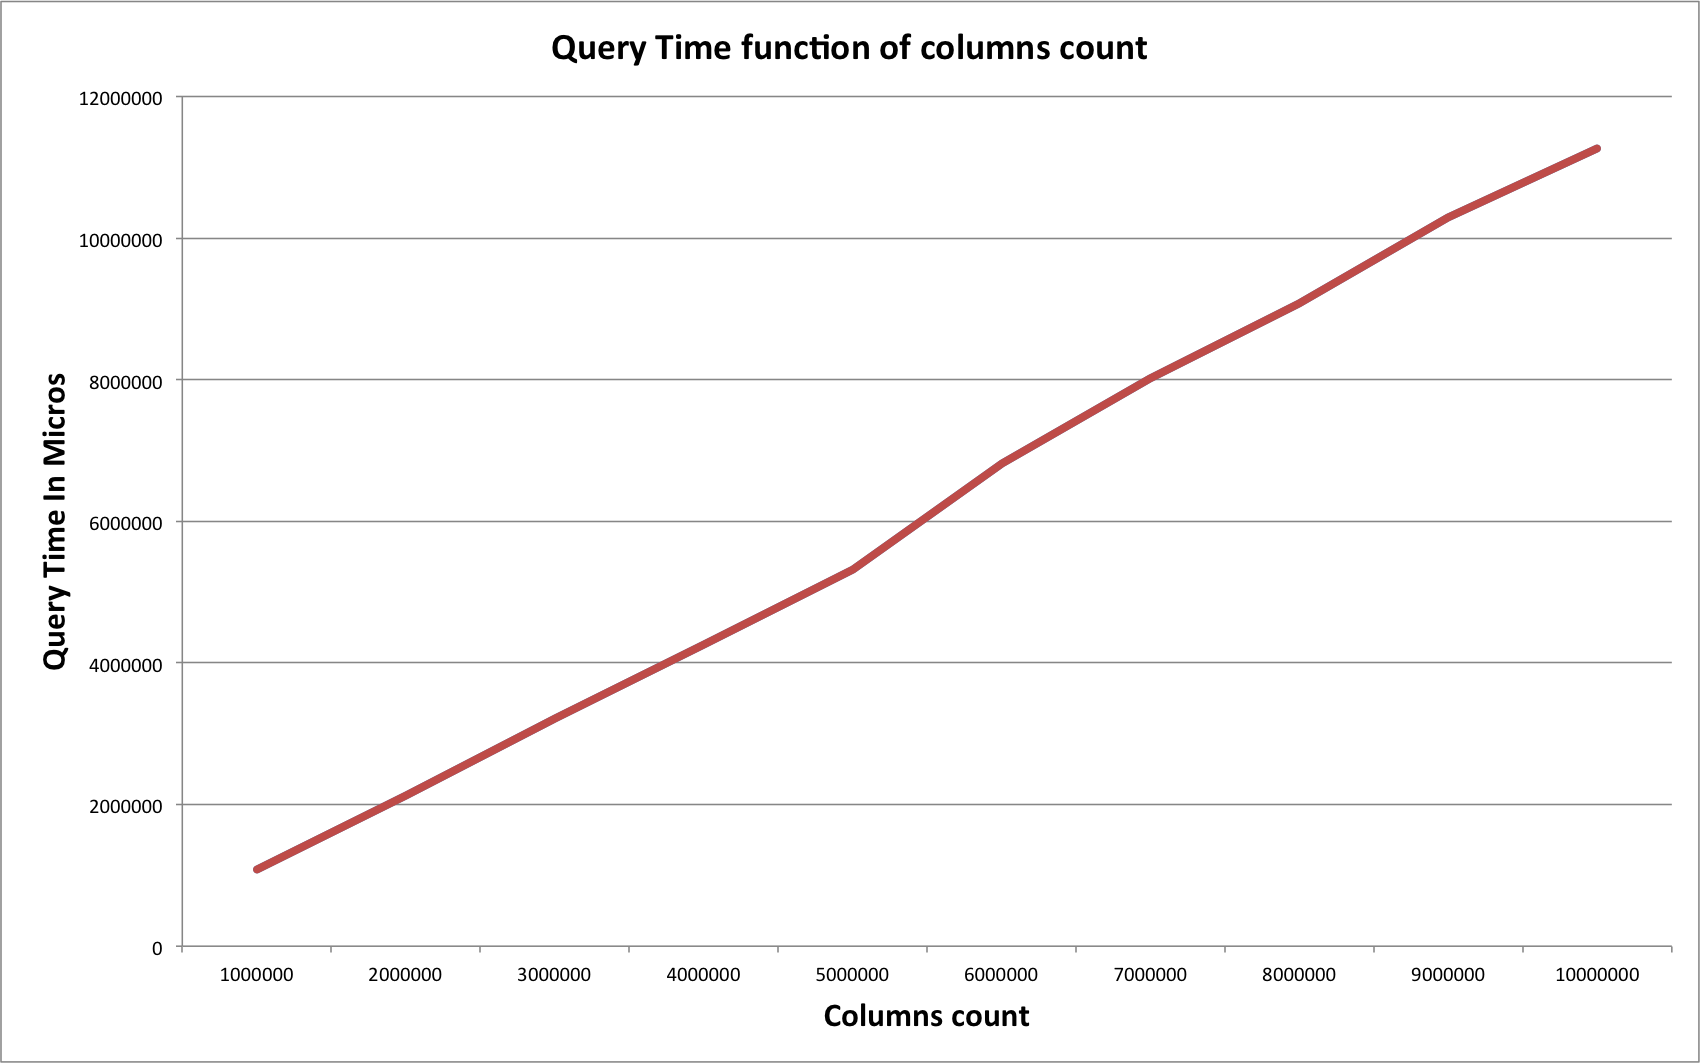
Query Time vs Columns Count
As expected, the query time grows linearly with the number of fetched columns.
One interesting notice, the query SELECT avg(value) FROM test_uda.sensor; whose result is strictly identical to SELECT avg(value) FROM test_uda.sensor WHERE sensor_id=10; because the table has only 1 partition, is always longer by 1 second. This extra cost may be related to range scan on all partitions.
E Some warnings
The above tests are very simples and are not meant to cover all possible use-cases. They have been designed to confirm my initial intuition about the need to extend timeout value from the driver side.
The aggregation function in use, avg(), is very simple. I did not discuss in this blog post the impact of the aggregation function itself on performance and stability of the cluster.
Indeed, imagine you design your own aggregate function in which you accumulate lots of data into the state object of the aggregate. This will have a significant, if not terrible, impact on the coordinator node. Keeping a great amount of data in the Java heap may lead to early promotion of those into the heap old generation and may trigger the dreadful stop-the-world full GC cycles…
Apache Spark or UDA ?
Choice matrix
Many users are hesitating between using Cassandra 3.0 UDA or Apache Spark for their analytics and aggregation use-cases. Each method has its advantages and drawbacks summarized in the below table:
| Used consistency level | Single/Multi partitions operation | Recommended approach |
|---|---|---|
| ONE | Single partition | C* UDA with token aware driver because the aggregation is performed directly in the datastore and is node-local |
| ONE | Multiple partitions | Spark because the read operation is done in parallel on all nodes. Spark will apply the aggregation in memory. Also this method does not put heavy load on the coordinator |
| > ONE | Single partition | C* UDA. Data locality is no longer guaranteed by the Spark connector because of the consistency level and you’ll pay the extra cost of fetching all C* data into Spark memory for applying aggregation instead of applying it directly in the datastore layer |
| > ONE | Multiple partitions | This is the worst scenario. In this case, my intuition is that Spark will be a better choice than C* UDA. See explanation below |
Why Apache Spark seems better for full table aggregation ?
Let’s take the worst case scenario. Imagine you need to compute the average value on all your sensors, using consistency level QUORUM (for RF=3).
SELECT avg(value) FROM sensor;
It means that for each CQL row, Cassandra will need 2 copies of data out of 3 replicas. More precisely it will need 1 copy of the data + 1 digest of the data.
Since the Spark/Cassandra connector creates Spark partitions that map to Cassandra token ranges for data locality, the data fetching is done on every node. Each node acts as the coordinator for its primary token range and only needs to send 1 digest request to one of its replica. Of course, this process will be done page by page so for a given token range, there will be page_count number of digest requests. We suppose for the sake of simplicity that we’re using fixed token ranges and not virtual nodes. Below is how data are fetched using the connector:
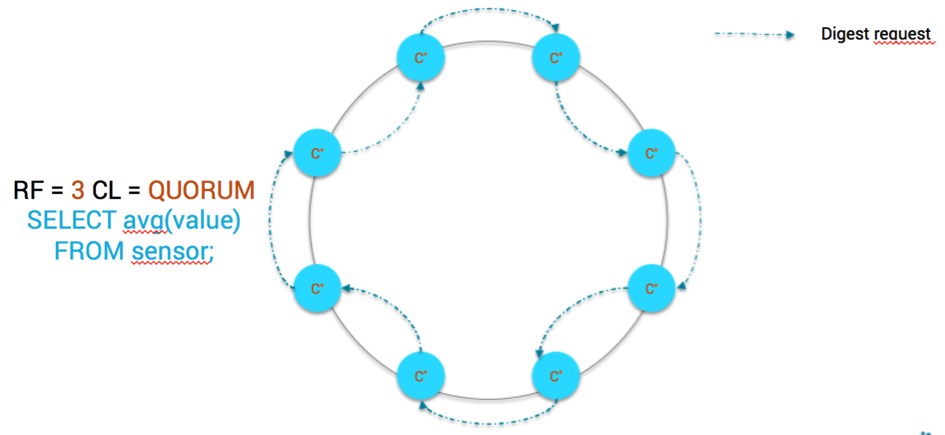
Aggregation With Spark
Please note that the digest requests and local data read are done in parallel on every Cassandra nodes.
If we were to rely on Cassandra UDA for this scenario, there would be a single coordinator which will:
- For each page of data:
- request real data from the fastest replica (relying on dynamic snitch)
- request digest from another replica
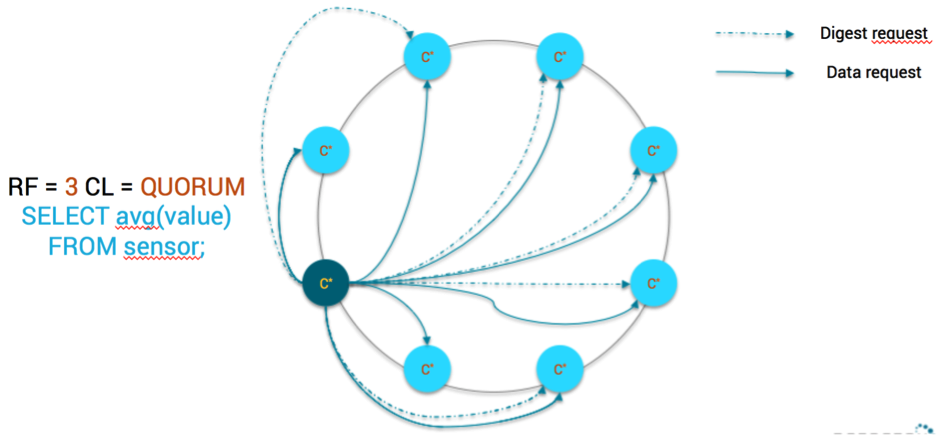
Aggregation With C* UDA
The drawbacks are pretty clear:
- Lower parallelism because there is only 1 coordinator to process all token ranges
- Raw data and digest need to be moved on the network
- High pressure on the coordinator
In a nutshell, for multi partitions aggregations, Spark seems to offer a better alternative if you have enough memory to process data on each node. If the local data set on each node largely exceeds available system memory, all bets are off.
WARNING: all the above reasoning is only an intuition based on the actual architecture of Cassandra UDA and Spark/Cassandra connector implementation. Proper benchmarks will real massive data is required to validate this intuition. Do not take this reasoning as granted
In a near future, when the Spark/Cassandra connector will be able to push down UDF and UDA into Cassandra, we’ll get the best of both world. Right now, just use C* UDA carefully.
And that’s all for today. I hope you enjoy those little benchmarks of mine. Remarks and comments are welcomed.
Pingback: The importance of single-partition operations in Cassandra
Great post!
I am beginning with Cassandra, how could I add Spark on top of it for multi partition or full table agregation?
regards
1. Install 1 spark worker on each Cassandra node
2. Install the Spark master on some node (choose it randomly, does not matter)
3. Use the Spark Cassandra driver